
Where IT Waste Really Comes From (and how FinOps turns it into a competitive advantage)
Where IT Waste Really Comes From (and how FinOps turns it into a competitive advantage)
IT wastage is rarely caused by bad intent or poor engineering. More often, it is structural. Cloud makes it easy to spin things up, SaaS makes it easy to subscribe, and AI-driven workloads make usage patterns harder to predict. Over time, small decisions stack up and budgets drift.
The result is a familiar tension: technology teams are asked to move faster and deliver more, while finance teams are asked to keep spend stable and explain every line. In a cloud-first world, those goals are now linked. The organisations that handle it well do not “cut IT”. They put in place an operating model that makes spend visible at decision time, and ties it to outcomes.
This is where FinOps (Financial Operations) comes in: not as a cost-cutting exercise, but as a shared decision framework between CTOs, CFOs and delivery teams.
1) Idle and under-utilised cloud resources
Cloud environments grow quickly. Test environments, oversized instances, unused storage, duplicate backups, and legacy workloads can sit quietly in the background, consuming budget month after month.
Why it happens: architecture and delivery evolve faster than tidy-up. Teams launch a project, meet the deadline, and move on. The clean-up never becomes urgent, so it never becomes scheduled.
From the CTO’s perspective, the problem is technical drift: environments change, dependencies multiply, and there is no single “owner” for retiring what is no longer needed. From the CFO’s perspective, it shows up as spend growth without a clear explanation, and a lack of confidence in forecasts.
2) SaaS and tool sprawl
Most organisations do not buy SaaS in one place. Departments purchase tools independently to solve immediate problems. Licences stack up, usage declines, but contracts renew.
Why it happens: procurement is often decentralised, and the cost of switching tools is higher than the cost of renewing them. Over time you end up with overlapping products, duplicate functionality and integration complexity.
From the CTO’s perspective, tool sprawl creates fragmentation: more vendors, more data silos, more security exposure, and more effort to integrate. From the CFO’s perspective, it becomes rising fixed costs with unclear return on investment, particularly when usage does not match the licence count.
3) Lack of cost visibility at decision time
Most cost reporting happens after the money is spent. Teams build solutions, deploy them, then review the bill weeks later.
Why it happens: cost data is not embedded into design and delivery workflows. Engineers make sensible performance and resilience choices, but do not see the cost impact in the moment.
This creates a gap. CTOs can make architectural decisions without real-time cost consequences. CFOs see the bill, but not the technical drivers behind it. The gap creates tension and leads to poor decisions on both sides. Finance pushes blunt controls. Technology works around them. Waste increases.
4) AI and high-variance workloads
AI, analytics and data platforms introduce unpredictable cost patterns. Usage can spike, training and inference workloads can vary, and experimentation can multiply quickly.
Why it happens: innovation is exploratory by nature, and AI workloads often scale in a non-linear way. Traditional budgeting approaches struggle with that volatility.
From the CTO’s perspective, forecasting usage is difficult and teams need room to experiment. From the CFO’s perspective, budgeting volatility is risky. Without governance, innovation becomes financially uncertain, and that uncertainty slows adoption.
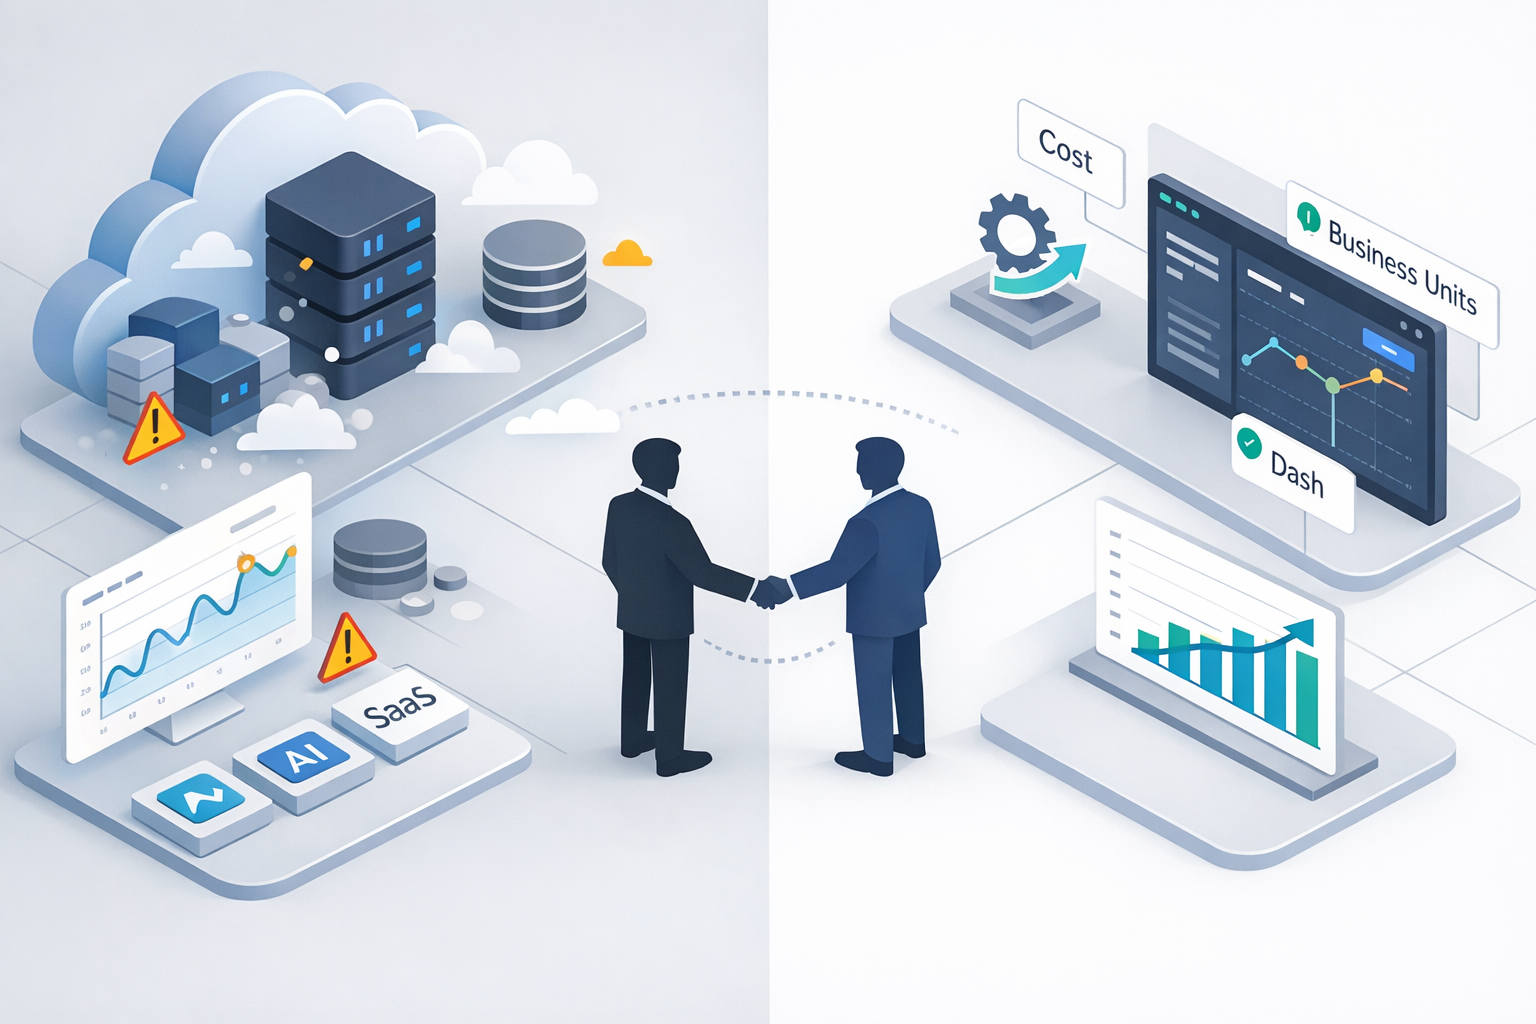
Why CTOs and CFOs now share the same problem
Historically, CTOs optimised for performance and resilience. CFOs optimised for cost and predictability. In cloud-first organisations, those goals are inseparable.
Every architectural decision has a financial consequence: region choice, backup policy, scaling strategy, storage tiering, logging retention, redundancy models and third-party tooling all change the bill. Every financial constraint shapes technical design: spend caps influence availability targets, deployment frequency, test strategy and even which features get built.
The organisations that perform best accept this reality and redesign how decisions are made. They adopt FinOps-driven operating models so technology and finance can make faster, better choices together.
FinOps: the common language between technology and finance
FinOps (Financial Operations) connects engineering, finance and leadership around a simple principle:
Technology spend must be visible, measurable and aligned to business value — in real time.
In practice, FinOps brings cost information into the same cadence as delivery. It creates shared visibility across cloud, SaaS and licensing, and it assigns clear ownership so decisions can be made with facts rather than assumptions.
What it means for CTOs
- Freedom to innovate with guardrails
- Cost insight during design and deployment, not just after billing
- Fewer reactive budget conversations
- Stronger credibility at board level
What it means for CFOs
- Predictable spend without blocking innovation
- Accountability for where money is going, and why
- Improved forecasting accuracy
- Reduced waste without blunt cost-cutting
- FinOps does not slow delivery. It removes financial uncertainty from delivery.
What good CTO–CFO collaboration looks like in practice
High-performing organisations share a few common traits:
- Shared cost visibility: both teams see the same data (cloud, SaaS, licensing and infrastructure) mapped to services, products and business units.
- Ownership, not blame: engineering owns usage;
finance owns governance; leadership owns priorities and trade-offs.
- Cost-informed design: architectural decisions are evaluated on performance and lifecycle cost, not just technical preference.
- Automation over manual control: rightsizing, anomaly detection and optimisation are automated where possible, not left to spreadsheets and quarterly reviews.
- Board-ready reporting: costs are explained in business terms — what changed, why it changed, and what value it supports.
From cost control to competitive advantage
When CTOs and CFOs operate in lockstep, waste reduces without slowing delivery. Innovation becomes financially sustainable. IT shifts from “cost centre” to strategic investment engine, and boards gain confidence in technology-led growth.
This is not about spending less. It is about spending deliberately.
Altiatech perspective
At Altiatech, we see more organisations moving towards this model because the drivers are not going away: cloud growth, SaaS expansion, cyber risk and AI adoption all increase complexity. The winners are not the organisations with the biggest budgets. They are the ones with clarity, control and alignment between technology and finance.
If you want to reduce waste and improve predictability without blocking delivery, start with three practical steps:
- Baseline your spend and map it to services and owners.
- Agree guardrails and decision points (what needs approval, what is automated, what is monitored).
- Create a reporting rhythm that turns cost into a management signal, not an after-the-fact surprise.
Ready to move from ideas to delivery?
Whether you’re planning a cloud change, security uplift, cost governance initiative or a digital delivery programme, we can help you shape the scope and the right route to market.
Email:
innovate@altiatech.com or call
0330 332 5842 (Mon–Fri, 9am–5:30pm).
Main contact page: https://www.altiatech.com/contact